Charts
CPP (Cost per Paid User)
Learn what the CPP chart measures and when to use it.
What it shows
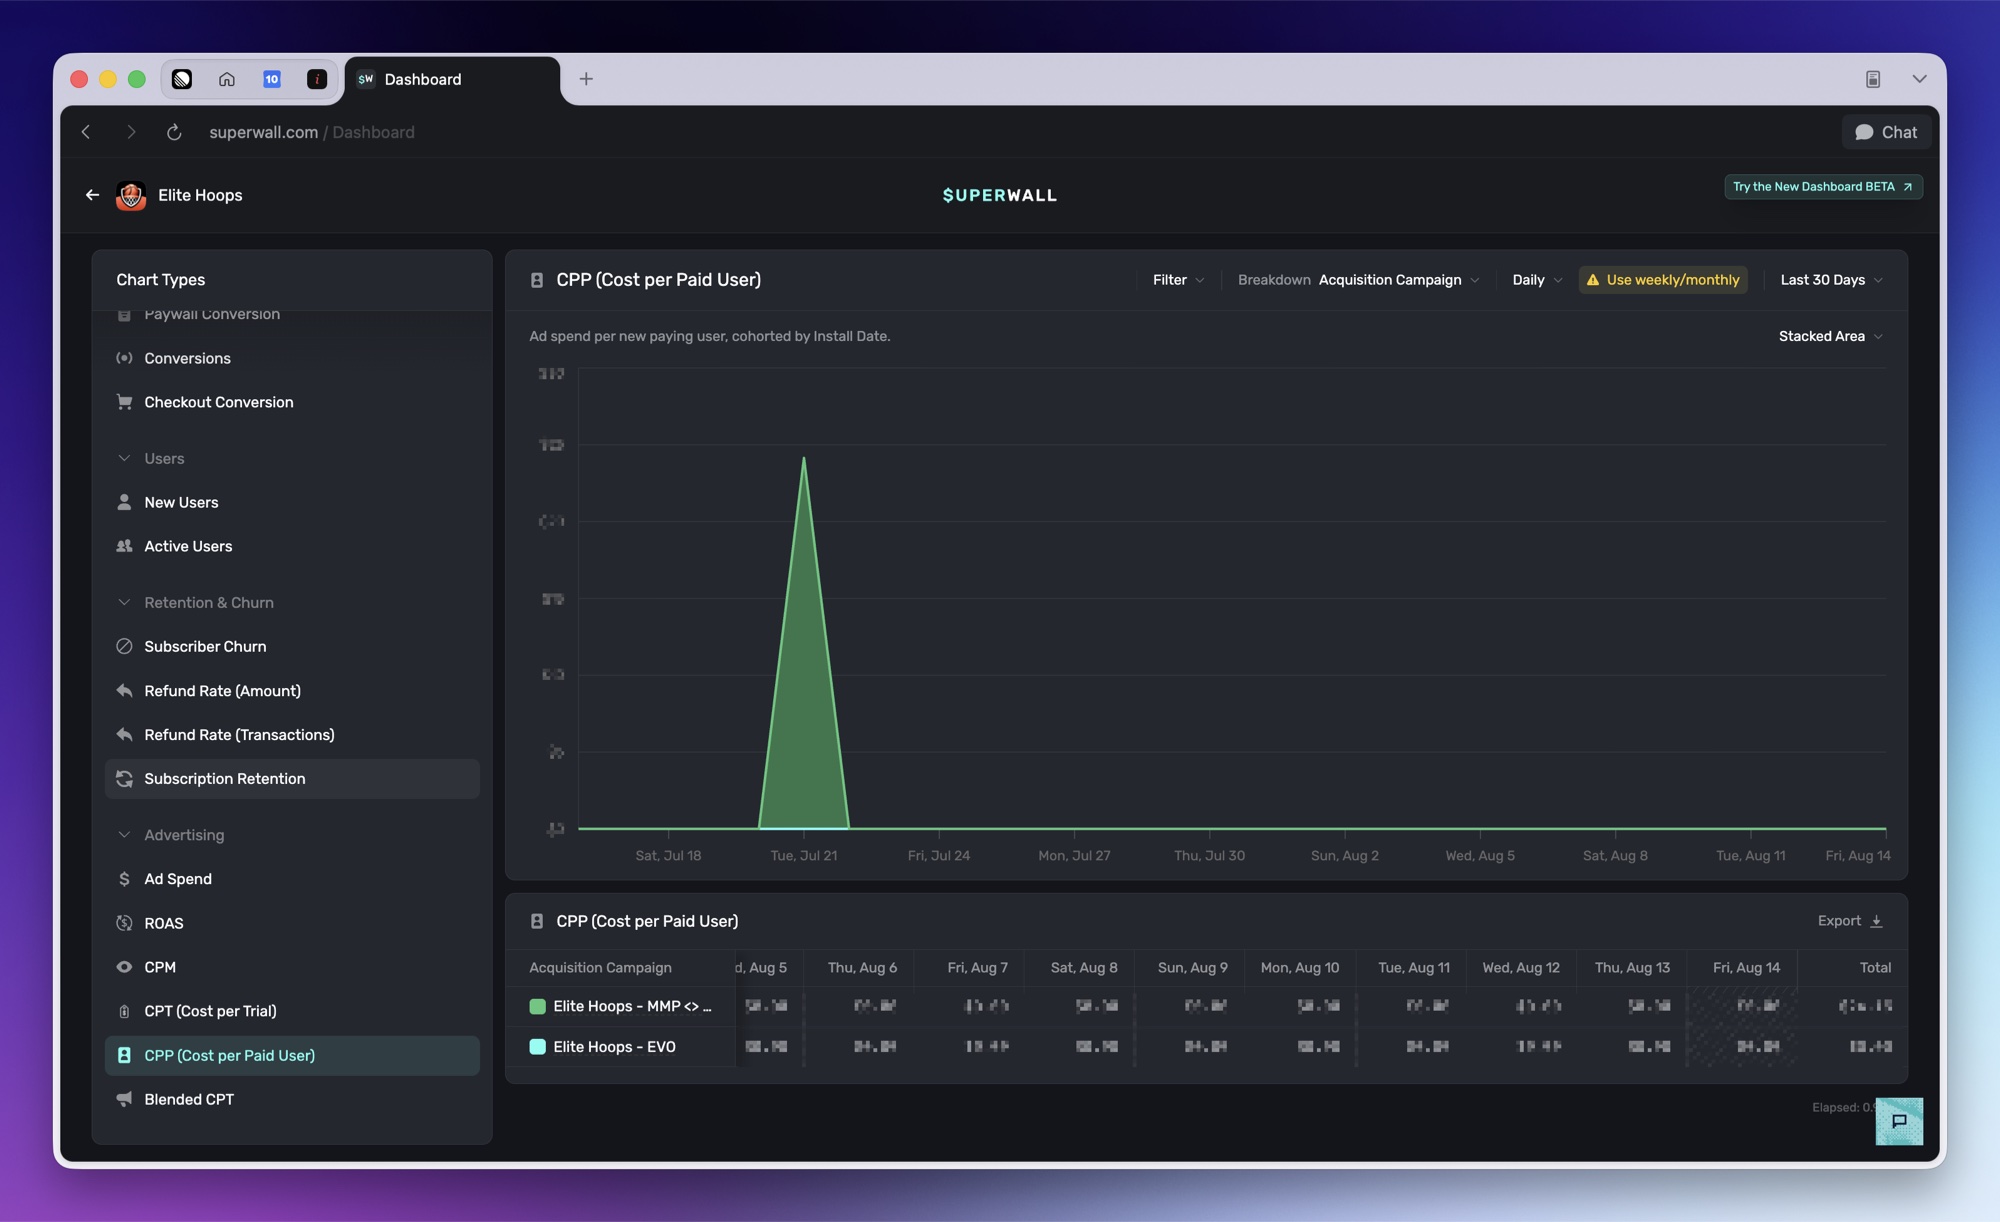
CPP shows ad spend per new paying user, cohorted by install date.
How to use it
Break down by Acquisition Campaign to compare what a paying user costs you from each campaign. This is the number to watch if your app sells without trials.
Good to know
Because values are cohorted by install date, daily buckets miss most spend-to-purchase matches. The chart defaults to weekly intervals and warns you when Daily is selected.
Advertising charts appear once performance marketing is enabled for your app. See Meta Ads.
How is this guide?